Your (usually) monthly fix on the current state of Android.
About once a month, Google releases distribution numbers that outline the various Android versions and the percentage of current devices they're running on. This data is meant for developers so they can create and update their apps according to which Android versions are the most popular, but they also give enthusiasts like us a glimpse into how quickly OEMs are adopting the latest and greatest the platform has to offer.
To source this data, Google tracks the Android versions of any devices accessing the Play Store over the course of a 7-day period. This ensures that only active Android gadgets are being accounted for and not your HTC Dream that's been sitting untouched in a drawer for the past few years.
Any version that accounts for 0.1% or more is listed, but versions that have less than that are ignored.
Without further ado, here's the current state of Android.
October 2018
Two months on, and there's still no Android Pie on the Android distribution numbers. Android Oreo is still steadily rising, and is now the second most used version of Android, behind its predecessor Android Nougat. The numbers for KitKat and below are still basically the same, with Gingerbread still hanging onto to the edge of the chart by its fingertips like a Ninja Warrior contestant, while we all sit on the sidelines screaming "Fall! FALL!! FALL!!!!"
Fruitcake is the holiday treat that's supposed to last forever, not Gingerbread! And with the holiday season about to be upon us, can someone please pass the Pie??
September 2018
August saw the release of Android Pie, and September saw the new version start pushing out to more and more devices, but alas, Pie is not on a big enough percentage of devices to warrant a slice on the pie chart, pun intended. Last year's Android version, Oreo is now available on 19.2% of Android devices, but over half of the Android devices that visited the Google Play Store this month were still running Nougat or Marshmallow.
While conventional wisdom says the holiday treat that lasts forever is fruitcake, Gingerbread is still hanging on at 0.3%, alongside Ice Cream Sandwich. Here's to hoping that Google can replace one or both of them with Pie in their pie chart by Christmas.
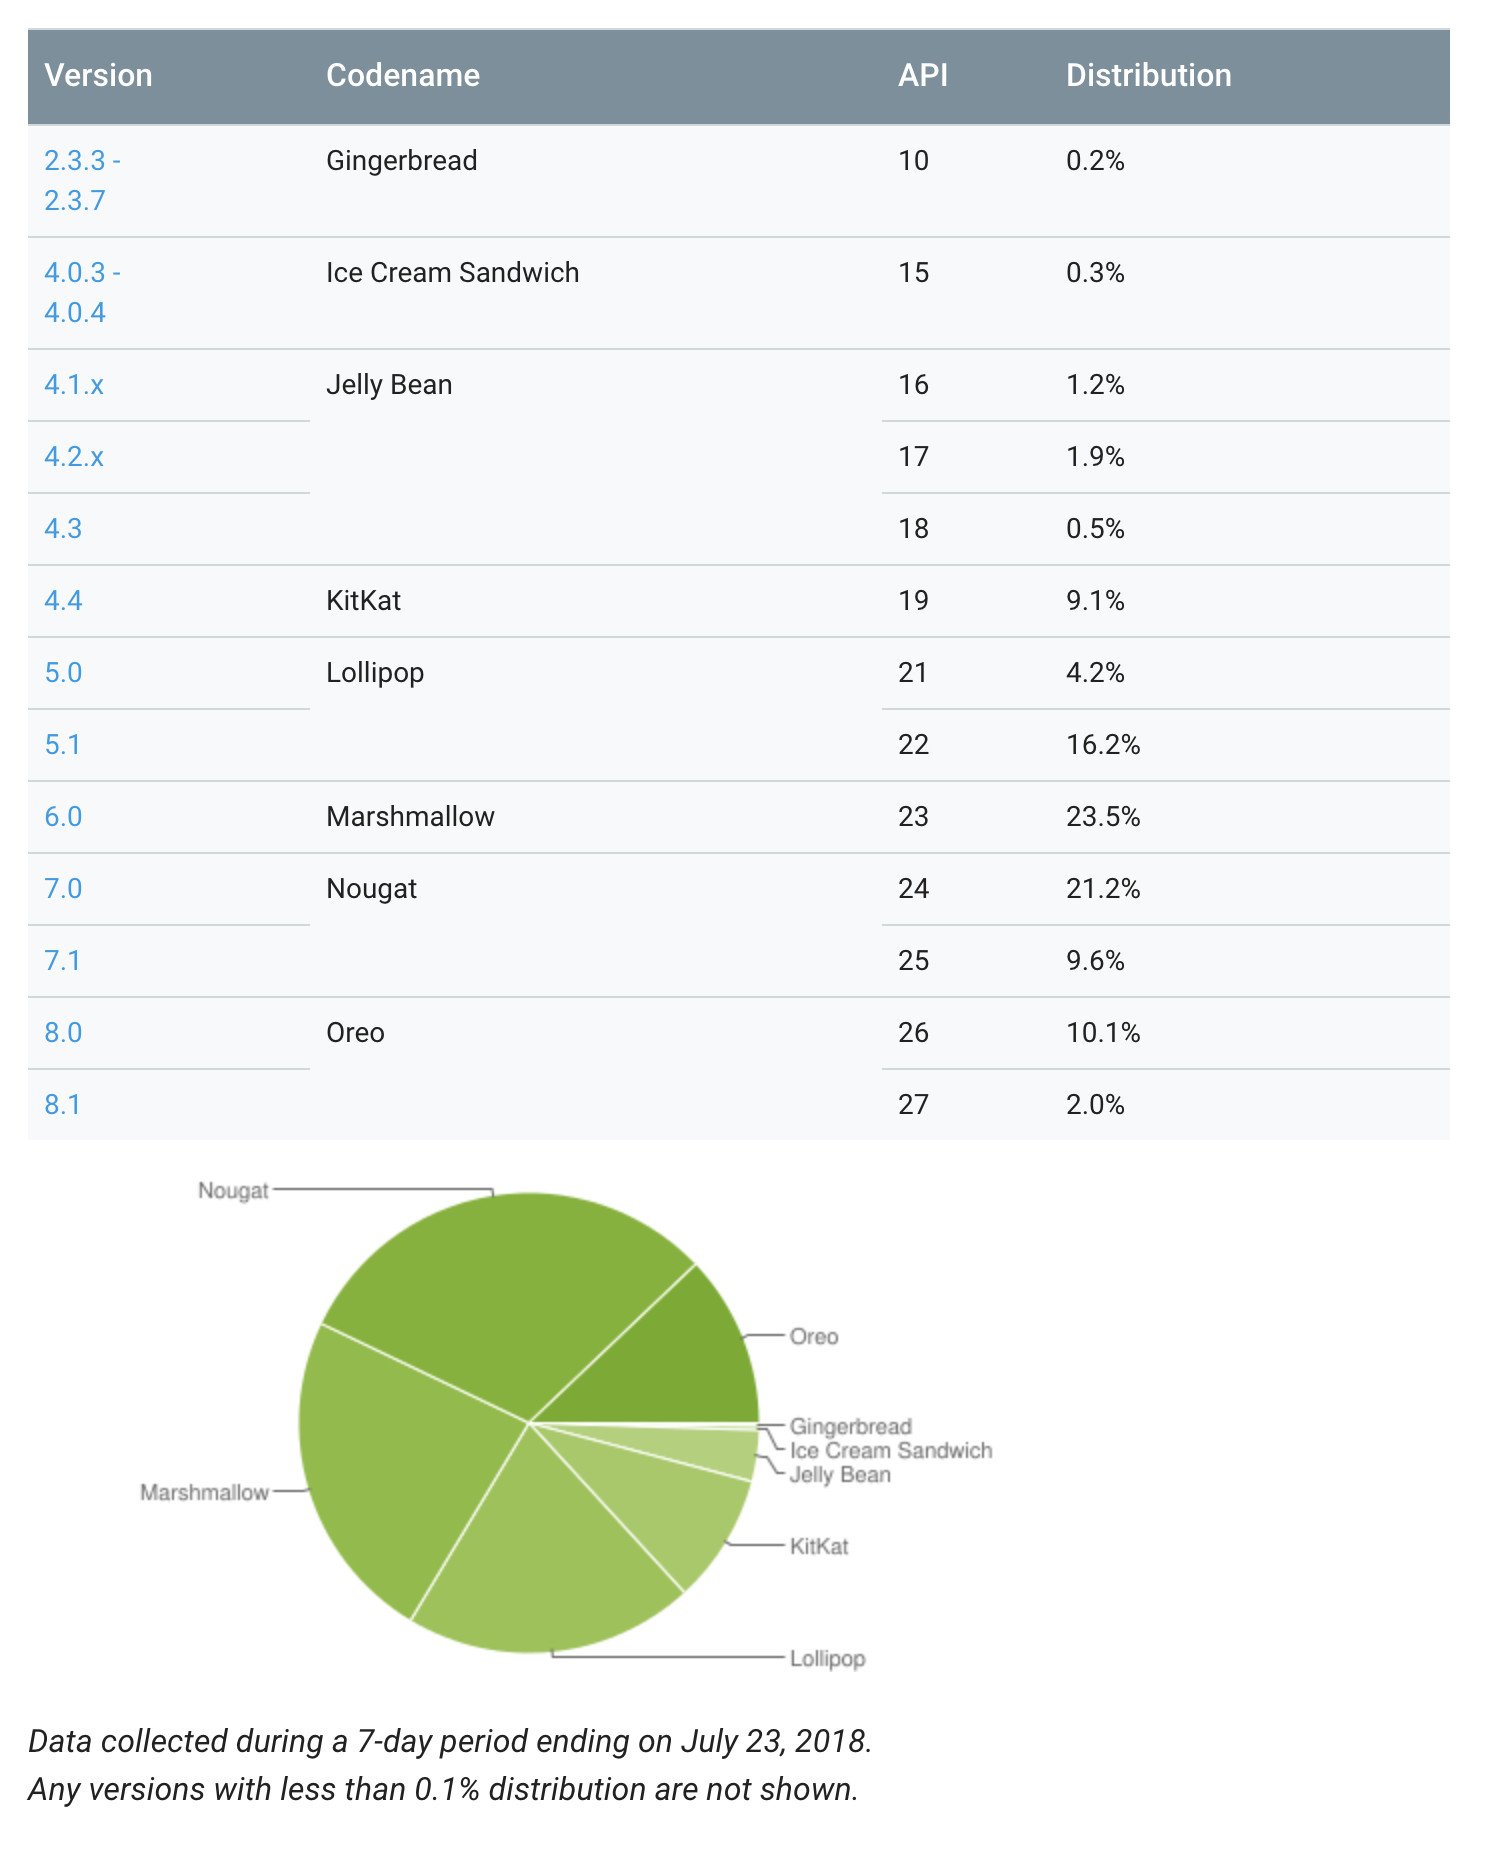
July 2018
It's been a hot minute since we got our last batch of distribution numbers, but after skipping over June, Google's back with an all-new set of data for July.
The biggest highlight for this month shows Android Oreo (8.0 and 8.1) now available on 12.1% of all devices — a huge step up from the 5.7% it saw just a couple months back. That's still not a great adoption rate, but at least we're getting somewhere.
The rest of the changes compared to May are as follows:
- Gingerbread — 0.1% decrease
- Ice Cream Sandwich — 0.1% decrease
- Jelly Bean — 0.7% decrease
- KitKat — 1.2% decrease
- Lollipop — 2% decrease
- Marshmallow — 2% decrease
- Nougat —0.3 decrease
- Oreo — 6.4% increase
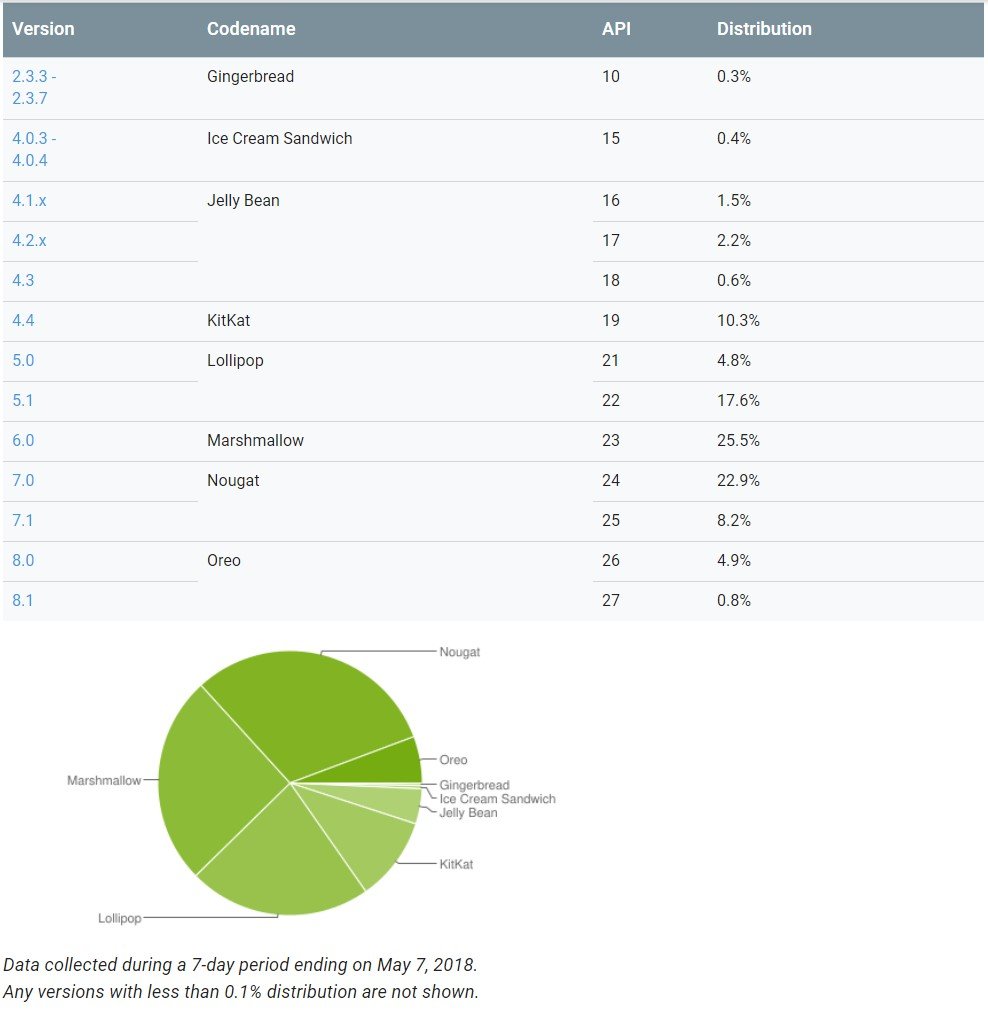
May 2018
The data for May corresponds to Play Store activity for the seven-day period ending on May 7. Oreo has picked up another percentage point over the course of the month, and is at 5.7% overall — 4.9% being 8.0 and the other 0.8% for 8.1.
Nougat also saw a slight increase from 30.8% to 31.1%, followed by Marshmallow by 25.5%. Here's the breakdown of how things changed:
- Gingerbread – No change
- Ice Cream Sandwich – No change
- Jelly Bean – 0.2% decrease
- KitKat – 0.2% decrease
- Lollipop – 0.5% decrease
- Marshmallow – 0.5% decrease
- Nougat – 0.3% increase
- Oreo – 1.1% increase
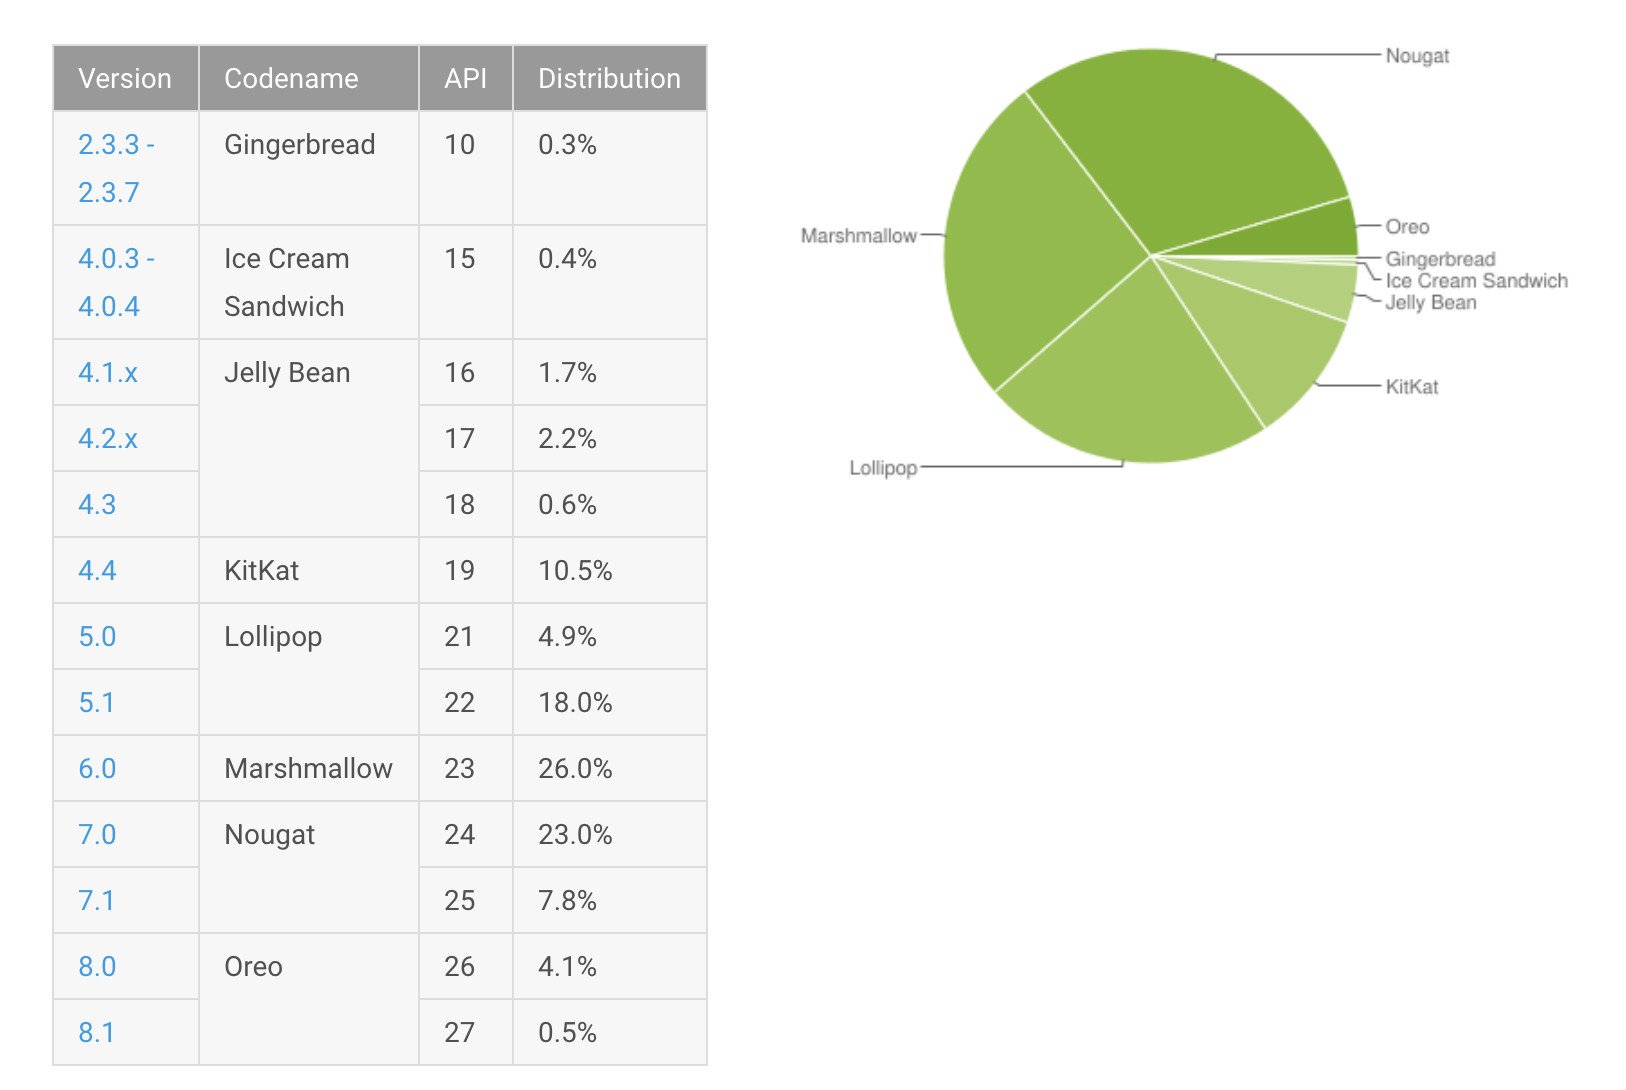
April 2018
For April of 2018, Google tracked Android devices accessing the Play Store for 7 days with the collection period ending on April 16.
The last report from February showed Oreo just barely accounting for more than 1% of Android devices, but that number has since climbed to 4.6% (4.1% being 8.0 and the other 0.5% going to 8.1). Nougat also sees an increase with a jump to 30.8% compared to 28.5% (7.1 and 7.0 combined), and Marshmallow is still trailing in second place at 26%.
Comparing these numbers to February's findings:
- Gingerbread – No change
- Ice Cream Sandwich – No change
- Jelly Bean – 0.5% decrease
- KitKat – 1.5% decrease
- Lollipop – 1.7% decrease
- Marshmallow – 2.1% decrease
- Nougat – 2.3% increase
- Oreo – 3.5% increase
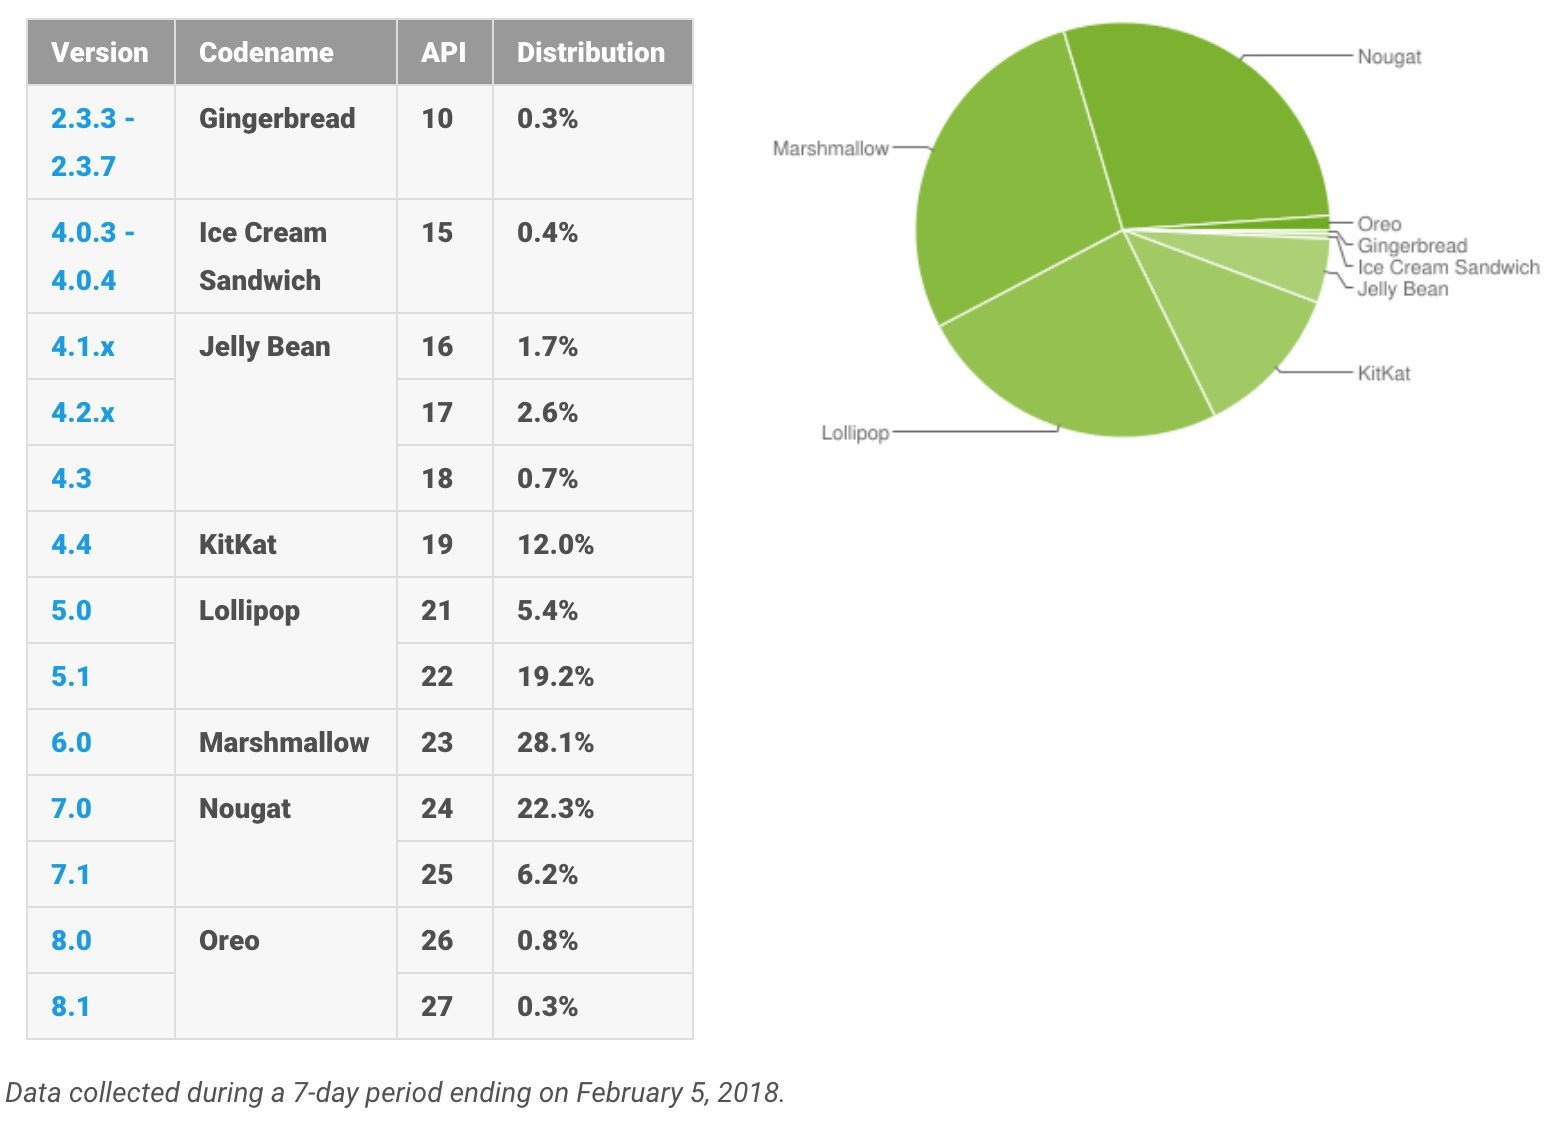
February 2018
February's report was the first time Android Oreo crossed the 1% threshold despite that version of the OS being released back in August of last year.
Marshmallow continued with a tight grip at 28.1%, but this also marked the first time that Android Nougat jumped into first place with a combined total of 28.5% – that including versions 7.0 and 7.1.
Additionally, Ice Cream Sandwich (4.0.3 to 4.0.4) also finally dropped to 0.4% from last January's 0.5%.
January 2018
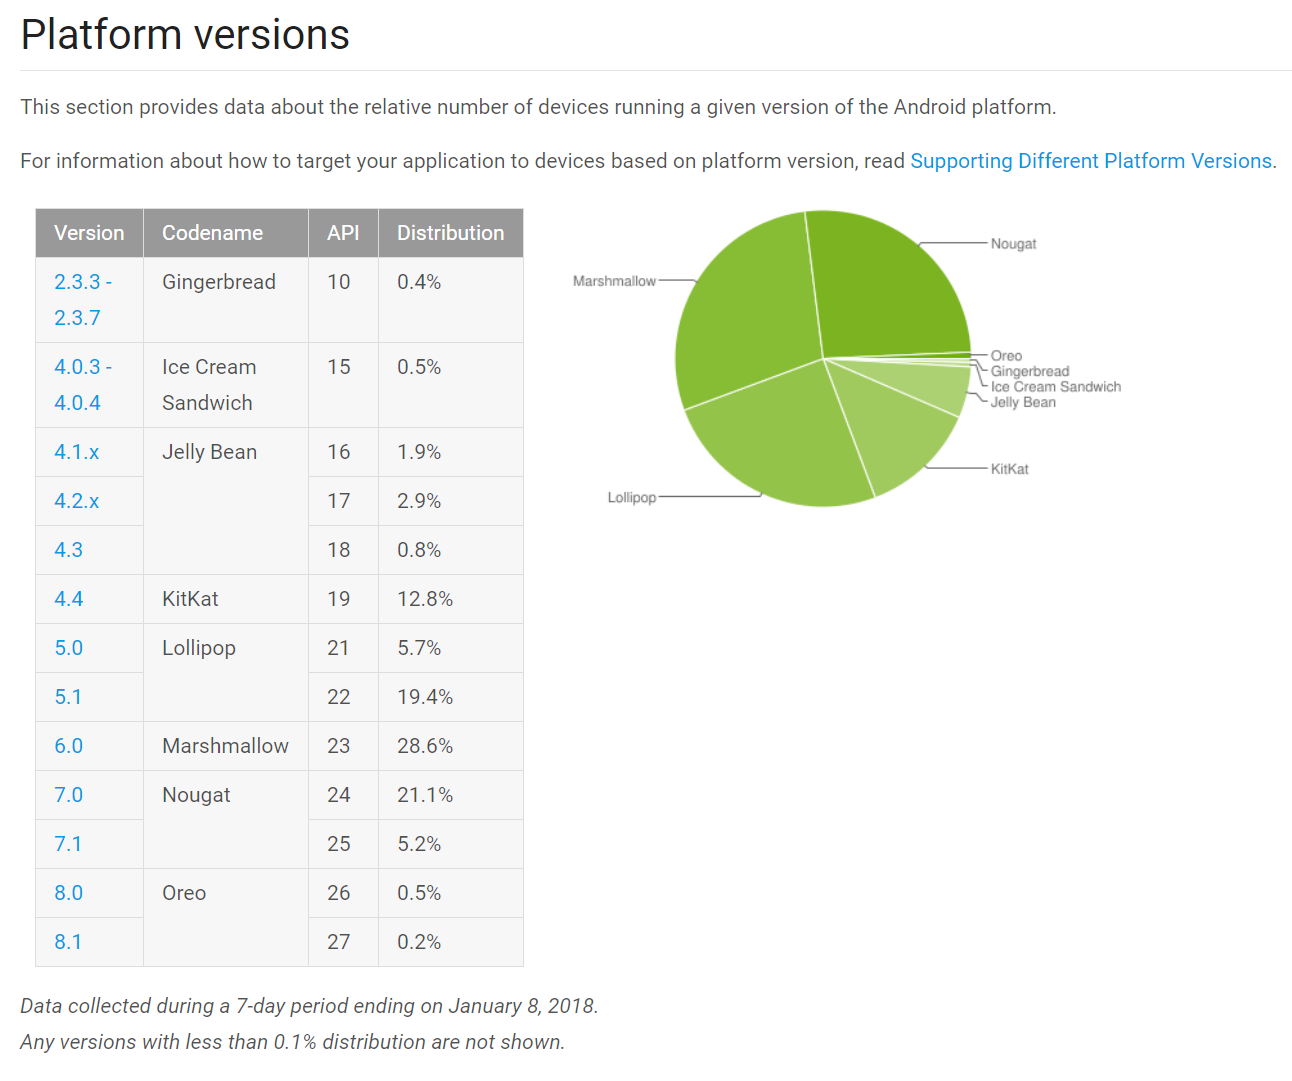
In January 2018, Android Marshmallow still reigned supreme as the most popular version of the OS at 29.7%. This also saw 8.1 Oreo make an appearance on the board for the first time with 0.2% adoption, and 8.0 remained at the same 0.5% it was at in December.
Jellybean and KitKat both decreased compared to last month's check-in, but Ice Cream Sandwich and Gingerbread are still holding on at the same 0.5% and 0.4%, respectively.
What version of Android are you running?
What about the phone you're using? What one is it and what version of Android is it rocking? Sound off in the comments below and let me know!
from Android Central - Android Forums, News, Reviews, Help and Android Wallpapers




0 comments: